Principal Component Analysis
This notebook is based upon the data presented here which is worth reading.
    import numpy as np
    import matplotlib.pyplot as plt
    import scipy.linalg
    from sklearn.utils.extmath import svd_flip
    from sklearn.decomposition import PCA
    plt.style.use('seaborn-v0_8-whitegrid')
First define a helper function which plots the direction of the principal components
def draw_vector(v0, v1, ax=None):
    """Helper function to plot principal component directions"""
    ax = ax or plt.gca()
    arrowprops=dict(arrowstyle='->', linewidth=2, shrinkA=0, shrinkB=0)
    ax.annotate('', v1, v0, arrowprops=arrowprops)
Create random data, $X$, using 200 samples and 2 features. Using the same seed as the source document
n_samples: int = 200
n_features: int = 2
rng = np.random.RandomState(1)
X = np.dot(rng.rand(n_features, n_features), rng.randn(n_features, n_samples)).T
Perform PCA extracting all the components, i.e. n_components = n_features
pca = PCA(n_components=2)
pca.fit(X)
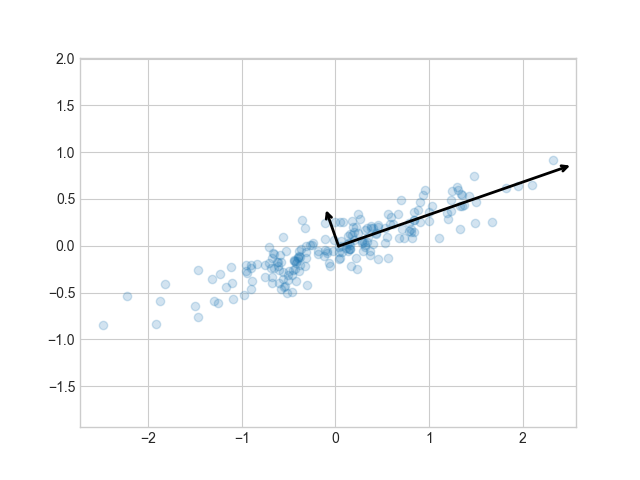
Plot the data
fig1, ax1 = plt.subplots(1, 1)
ax1.scatter(X[:, 0], X[:, 1], alpha=0.2)
for length, vector in zip(pca.explained_variance_, pca.components_):
    v = vector * 3 * np.sqrt(length)
    draw_vector(pca.mean_, pca.mean_ + v, ax=ax1)
ax1.axis('equal')

It is possible to unpack the steps performed by scipy. First centre the data
mean_ = np.mean(X, axis=0)
Z = (X - mean_)
Perform the singular value decomposition
U, s, Vt = scipy.linalg.svd(Z, full_matrices=False)
flip the signs of the eigenvectors to enforce consistent output
U, Vt = svd_flip(U, Vt, u_based_decision=False)
Check data is same as scipy routine
explained_variance_ = (s**2) / (n_samples - 1)
components_ = Vt
print("\nmean:", mean_, pca.mean_)
print("\nvariance:", explained_variance_, pca.explained_variance_)
print("\ncomponents:", components_, pca.components_)
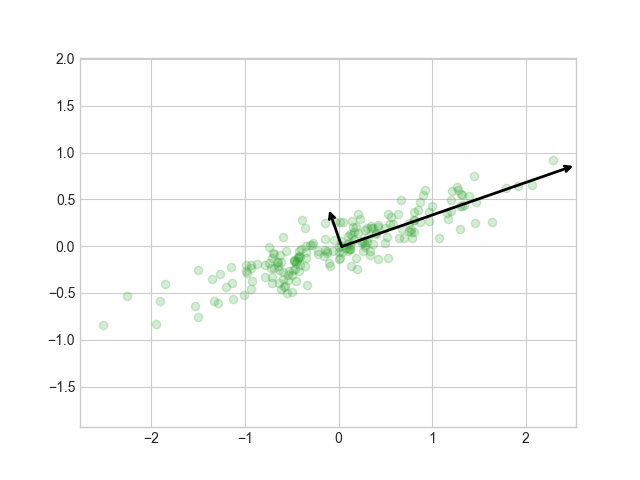
plot results
fig2, ax2 = plt.subplots(1, 1)
ax2.scatter(Z[:, 0], Z[:, 1], alpha=0.2, c='tab:green')
for length, vector in zip(explained_variance_, components_):
    v = vector * 3.0 * np.sqrt(length)
    draw_vector(mean_, mean_ + v, ax=ax2)
ax2.axis('equal')
plt.show()
