Taylor Series
Taylor Series Expansion
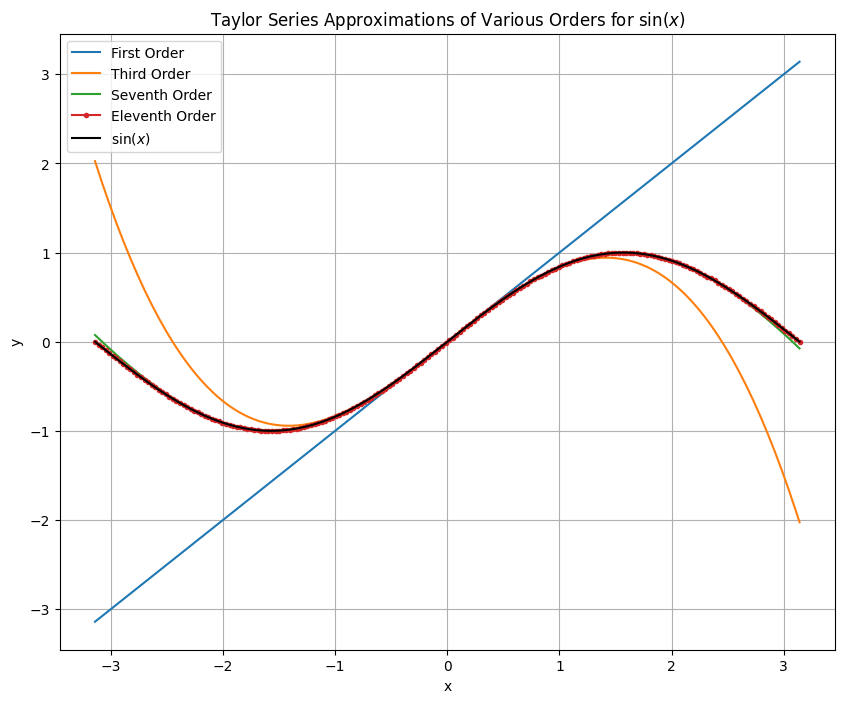
This notebook presents the Taylor series expansion of the sine function, $\sin\left( x\right)$ close to zero for an increasing number of terms in the approximation.
Given a function $f : \mathbb{R} \mapsto \mathbb{R}$ which is infinitely differentiable at a point $c$, the Taylor series of $f(c)$ is given by
$$ \begin{equation*} \sum\limits_{k=0}^{\infty} \dfrac{ f^{(k)} \left( c \right) }{k!} \left( x - c \right)^{k}. \end{equation*} $$Thus, as $f^{\prime} = \cos\left(x\right)$, it can be shown that
$$ \begin{equation*} \sin \left( x \right) \approx x - \dfrac{x^3}{3!} + \dfrac{x^5}{5!} - \dfrac{x^7}{7!} \ldots \end{equation*} $$Note that in this example, only odd powers of $x$ contribute to the expansion.
First import the tools needed
import numpy as np
from math import factorial
import matplotlib.pyplot as plt
Define the $x$ values and set up a figure for plotting
x = np.linspace(-np.pi, np.pi, 200)
plt.figure(figsize = (10,8))
First begin with the first order approximation
n = 0
approximate $y$ values
y = np.zeros(len(x))
Because only every other term is not equal to zero, we only have to compute $n/2$ terms
n = n / 2
Taylor series expansion up to $n$
for i in np.arange(0, int(n)+1):
  y = y + ((-1)**i * x**(2*i+1)) / factorial(2*i+1)
Plotting
plt.plot(x, y, label = 'First Order')
Third order (same structure as before)
n = 2
y = np.zeros(len(x))
n = n / 2
for i in np.arange(0, int(n)+1):
  y = y + ((-1)**i * (x)**(2*i+1)) / factorial(2*i+1)
plt.plot(x, y, label = 'Third Order')
Seventh order
n = 6
y = np.zeros(len(x))
n = n / 2
for i in np.arange(0,int(n)+1):
  y = y + ((-1)**i * (x)**(2*i+1)) / factorial(2*i+1)
plt.plot(x, y, label = 'Seventh Order')
Eleventh order
n = 10
y = np.zeros(len(x))
n = n / 2
for i in np.arange(0,int(n)+1):
  y = y + ((-1)**i * (x)**(2*i+1)) / factorial(2*i+1)
plt.plot(x, y, label = 'Eleventh Order', marker='.')
Plotting of full solution, i.e. $\sin \left(x \right)$
plt.plot(x, np.sin(x), 'k', label = 'sin(x)')
plt.grid()
plt.title('Taylor Series Approximations of Various Orders for $\sin(x)$')
plt.xlabel('x')
plt.ylabel('y')
plt.legend()
plt.show()