Lagrange Interpolation
As will be seen, interpolation of regularly space intervals can produce unsatisfactory results.
First, load the tools needed.
import numpy as np
import matplotlib.pyplot as plt
plt.style.use('seaborn-poster')
Now define the basis polynomial function
def lagrange(x_int, y_int, x_new):
    """
    This function takes pairs of points (x_int, y_int) and, from a set of points x_new
    computes the Lagrange polynomial to return the interpolated values y_new
    """
    y_new = np.zeros(x_new.shape, dtype=np.float)
    for xi, yi in zip(x_int, y_int):
        y_new += yi * np.prod( [(x_new - xj) / (xi - xj) for xj in x_int if xi != xj], axis=0)
    return y_new
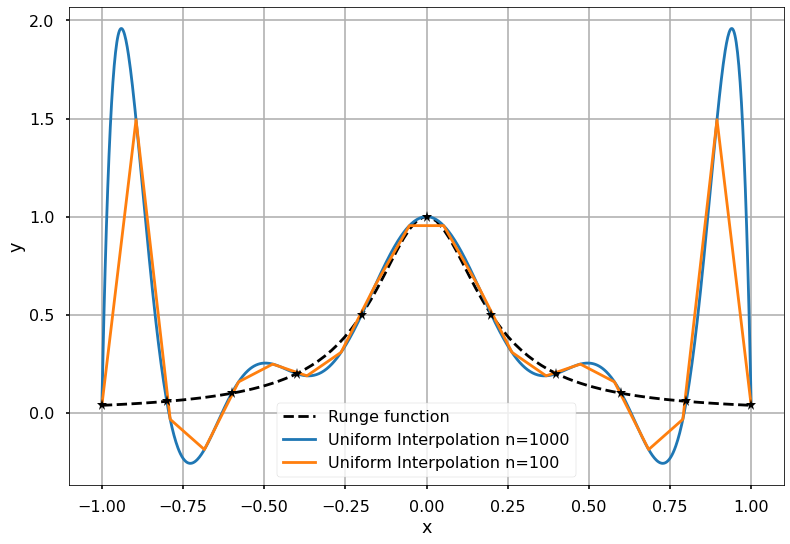
Define the Runge function as \begin{equation} f\left(x\right) = \dfrac{1}{1+25 x^2}\end{equation}
runge = lambda x: 1.0 / (1.0 + 25.0 * x**2)
Let the range be $(-1,1)$.
x = np.linspace(-1, 1, 100)
x_int = np.linspace(-1, 1, 11)
y_int = runge(x_int)
x_new = np.linspace(-1, 1, 1000)
y_new = lagrange(x_int, runge(x_int), x_new)
x_new0 = np.linspace(-1, 1, 20)
y_new0 = lagrange(x_int, runge(x_int), x_new0)
plt.plot(x, runge(x), "k--", label="Runge function")

plt.plot(x_new, y_new, label="Uniform Interpolation n=1000")
plt.plot(x_new0, y_new0, label="Uniform Interpolation n=100")
plt.plot(x_int, y_int, "k*")
plt.legend()
plt.xlabel("x")
plt.ylabel("y")
plt.grid(True)
plt.show()
import numpy as np
from scipy.interpolate import lagrange
import matplotlib.pyplot as plt
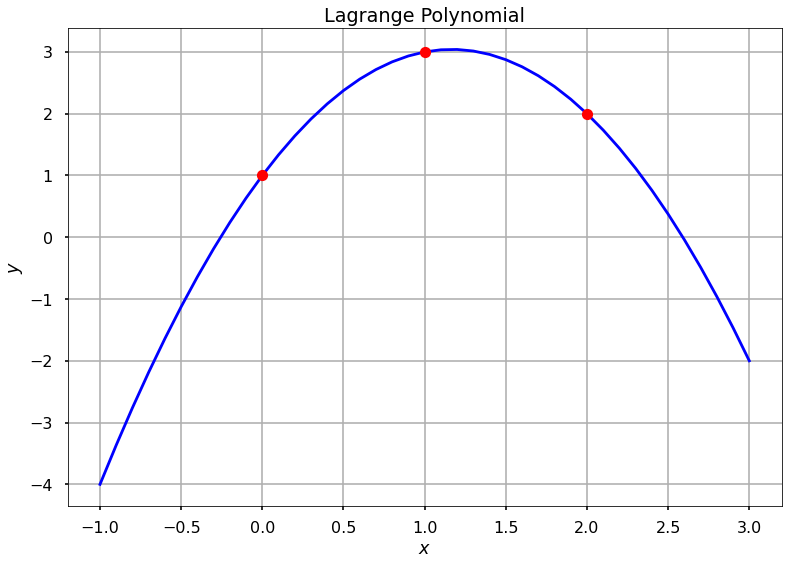
x = [0, 1, 2]
y = [1, 3, 2]
x_new = np.arange(-1.0, 3.1, 0.1)
f = lagrange(x, y)
fig = plt.figure()
plt.plot(x_new, f(x_new), 'b', x, y, 'ro')
plt.title(r'Lagrange Polynomial')
plt.grid()
plt.xlabel(r'$x$')
plt.ylabel(r'$y$')
plt.show()