Quadrature and Trapezium Rule
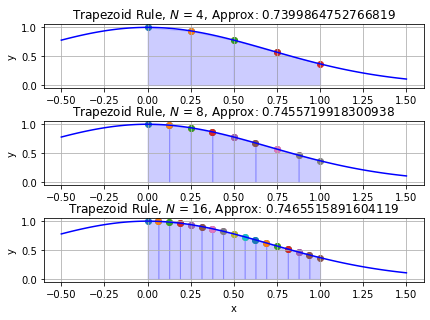
Consider the integration of the function $f(x) = \exp \left( -x^2 \right)$ between $[0,1]$.
$$ \begin{align} \int_0^1 e^{-x^2} \mathrm{d}x = \dfrac{\sqrt{\pi}}{2}. \nonumber \end{align} $$First import the tools needed
import numpy as np
import matplotlib.pyplot as plt
import scipy.integrate as spi
Next define the range to plot the function over and a number of point to evaluate the function.
x0 = -0.5
x1 = 1.5
n = 100
So we have a range and a function.
x = np.linspace(x0, x1, n)
y = np.exp(-x**2)
f = lambda x : np.exp(-x**2)
Let $m$ be vector whose elements are the number of evaluations of the integral.
m = np.array([4, 8, 16], dtype=int)
Compute and plot the successive approximations for the integral, as well as keeping track of the errors.
$$ \begin{align} \int_a^b f(x) \, \mathrm{d}x \approx \sum\limits_{k=1}^{M} \dfrac{f\left( x_{k-1}\right) + f\left(x_{k}\right)}{2} \Delta x_{k} \quad \textsf{where} \quad x_0 = a \quad \textsf{and} \quad x_M = b. \nonumber \end{align} $$fig, ax = plt.subplots(m.size,1)
fig.tight_layout()
fig.subplots_adjust(top=0.99)
T = np.zeros((m.size,))
absolute_error = np.zeros((m.size,))
relative_error = np.zeros((m.size,))
for j,k in enumerate(m):
nsteps = np.float(k)
dx = 1.0 / nsteps
x_approx = np.linspace(0.0, 1.0, num=k)
T[j] = spi.trapz(f(x_approx), x_approx)
for i in np.arange(0, nsteps):
x_start = i*dx
x_stop = (i+1)*dx
y_start = np.exp(-x_start**2)
y_stop = np.exp(-x_stop**2)
ax[j].fill_between([x_start,x_stop], [y_start,y_stop], facecolor='b', edgecolor='b', alpha=0.2)
ax[j].scatter([x_start,x_stop], [y_start,y_stop])
ax[j].plot(x, y, 'b-')
ax[j].set_title(r'Trapezoid Rule, $N$ = {}, Approx: {}'.format(k,T[j]))
ax[j].grid(True)
if (j==m.size-1):
ax[j].set_xlabel('x')
ax[j].set_ylabel('y')
absolute_error[j] = np.abs( np.sqrt(np.pi)/2.0 - T[j])
relative_error[j] = np.abs( (np.sqrt(np.pi)/2.0 - T[j])/(np.sqrt(np.pi)/2.0 ) )

Tabulate the data and display it
results = np.vstack([m.T, relative_error, absolute_error])
import pandas as pd
df = pd.DataFrame(results.T, columns=["Order", "Relative Error", "Absolute Error"])
df.Order = df.Order.astype(int)
display(df.style.hide_index().set_caption("Results for $e^{(-x^2)}$"))
| Order | Relative Error | Absolute Error |
|---|---|---|
| 4 | 0.165015 | 0.146240 |
| 8 | 0.158712 | 0.140655 |
| 16 | 0.157607 | 0.139675 |
The same process can be repeated for other integration routines presented in the lectures, such as Simpson’s rule or Gaussian quadrature.